Short Answer
The graph in the figure shows the position of an object as a function of time.The letters H-L represent particular moments of time.At which moments shown (H,I,etc.)is the speed of the object
(a)the greatest?
(b)the smallest? 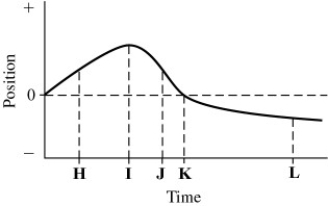
Definitions:
Related Questions
Q9: If you set the cruise control of
Q14: Shebing Corporation had $80,000 of $10 par
Q25: The wavelength of a certain laser is
Q28: A torque of 12 N • m
Q29: How much should the Parminter's Investment in
Q32: Piel Corporation (a U.S.company)began operations on January
Q35: A block slides down a frictionless inclined
Q41: A 20.0-N box rests on a 50.0-N
Q53: The figure shows a graph of the
Q115: A hockey puck slides off the edge