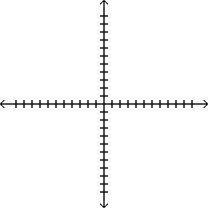
Suppose an investment increases by 10% every year.Graph the number of years invested as a function of the multiplicative increase in original investment.Label the graph with the name of the function. 
Definitions:
Q11: What is the change in sales between
Q41: Use the matrix operations on a graphing
Q61: Write the following in terms of ln
Q66: Suppose you leave an initial amount of
Q74: Sketch a graph of f(x)= <img src="https://d2lvgg3v3hfg70.cloudfront.net/TB6578/.jpg"
Q79: The demand function for a product is
Q80: A manufacturer produces two products,A and B.For
Q105: Determine the effective rate equivalent to an
Q200: Determine whether the following lines are parallel,perpendicular
Q224: If p = <img src="https://d2lvgg3v3hfg70.cloudfront.net/TB6578/.jpg" alt="If p