The figure shows a graph of the position x of two cars,C and D,as a function of time t. 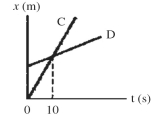 According to this graph,which statements about these cars must be true? (There could be more than one correct choice.)
Definitions:
Q16: In the quotient <span class="ql-formula"
Q23: An empirical formula relating the surface area
Q33: Brick A is dropped from the top
Q35: Either find the value of <img src="https://d2lvgg3v3hfg70.cloudfront.net/TB6578/.jpg"
Q49: The graph in the figure shows the
Q50: A small car meshes with a large
Q67: If z = (2x - y) <img
Q144: A manufacturer's marginal cost function is <img
Q145: Evaluate: <img src="https://d2lvgg3v3hfg70.cloudfront.net/TB6578/.jpg" alt="Evaluate: " class="answers-bank-image
Q253: If <img src="https://d2lvgg3v3hfg70.cloudfront.net/TB6578/.jpg" alt="If =