Multiple Choice
Use the following figure to answer the questions : Figure 7-1 shows the total product curve for different levels of a variable input,labor. 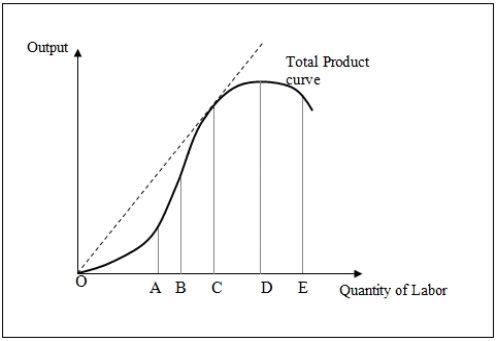
-Refer to Figure 7-1.To the left of point B:
Definitions:
Related Questions
Q2: A given per-unit excise tax will increase
Q9: Suppose,given their initial endowments of milk [M]
Q17: The initial endowment of goods:<br>A)has no effect
Q25: The slope of a ray from the
Q35: When comparing T-bills and stocks,a risk-averse investor
Q53: Each row and column heading describes a
Q55: Given the price [P],marginal cost [MC],and price
Q69: When the marginal rates of substitution differ,then:<br>A)mutually
Q74: A per-unit excise tax on a single
Q90: In an effort to deter alcohol consumption