Use the following figure to answer the question : Figure 9-4 : shows the marginal cost curve,the average cost curve,the average variable cost curve,and the demand curve for a firm over different levels of output.The market price is $P. 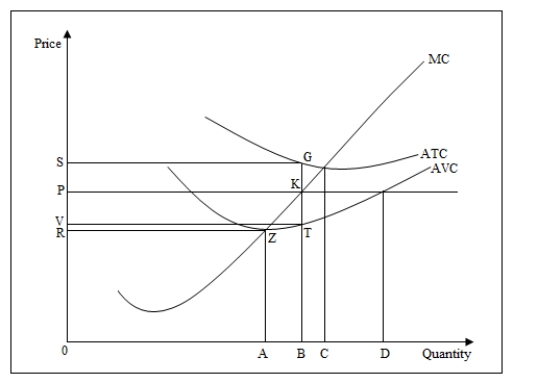
-Refer to Figure 9-4.The total variable cost for the firm at output level OB is _____.
Definitions:
Short Run
In economics, a period during which at least one input or factor of production is fixed, focusing on immediate outcomes.
Output Quantity
Refers to the total amount of goods or services produced by a company or within an economy during a specific time period.
Profit Maximizing
A strategy or point where a firm achieves the highest possible profit given its production costs, sales price, and output level.
Monopoly Firm
A company that is the sole provider of a particular product or service in a market, lacking direct competition.
Q21: For a risk-neutral individual,with return on the
Q25: In the long run,the imposition of an
Q40: In Figure 7-2,at point D _.<br>A)total product
Q48: A firm's costs are determined by:<br>A)its production
Q50: In the dominant firm model of oligopoly,the
Q68: Which of the following practices allows insurance
Q80: Block pricing by electric utilities is an
Q82: The city planning authority in a city
Q95: A consumer is willing to pay a
Q106: Which of the following is true at