Use the following figure to answer the question : Figure 19-1 :
,the curve TT shows how the allocation of a resource affects the well-being of two individuals,Hank and Monica. 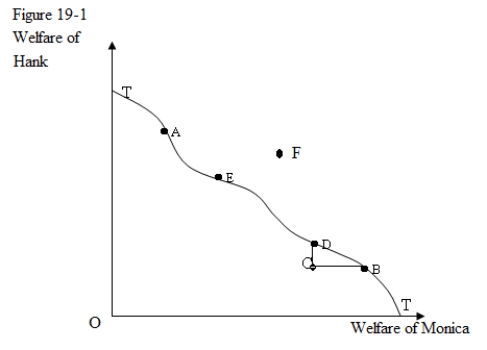
-In Figure 19-1,a movement from A to B would represent:
Definitions:
Standard Rate (SR)
Standard Rate (SR) refers to a predefined or established cost or value used in financial and operational calculations, often applied in budgeting and cost accounting.
Actual Hours (AH)
The real number of hours worked or required to complete a specific task or project, as opposed to estimated or planned hours.
Standard Hours (SH)
Standard Hours (SH) refer to the estimated time considered necessary to perform a task or produce a good under normal conditions, used for planning and efficiency analysis.
Materials Price Variance
The difference between the actual cost of materials used in production and the standard cost of those materials.
Q4: List and explain four examples (out of
Q15: In Figure 20-2,the efficient output is _
Q23: A detailed aging of open item accounts
Q27: Which of the following will be a
Q34: What are the three types of firewalls?<br>A)
Q35: Suppose the government imposes a policy which
Q36: Sales, sales order processing, shipping, and accounts
Q47: What is the long run effect of
Q53: What does (5) represent?<br>A) Total cost<br>B) Loss
Q87: Consider an individual whose income increases substantially.This