USE THE INFORMATION BELOW FOR THE FOLLOWING PROBLEM(S)
Consider the data presented below on three mutual funds and the market.
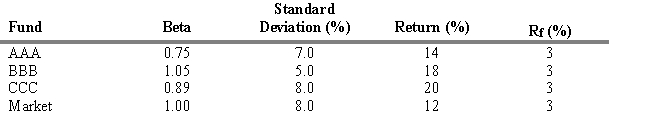
-Refer to Exhibit 18.3. Compute the Jensen Measure for the BBB fund.
Definitions:
Strong-Form Market Efficiency
Describes a market where all information, public and private, is reflected in stock prices, and nobody can achieve superior gains.
Market Value
The current quoted price at which an asset or a service can be bought or sold.
Intrinsic Value
The inherent worth of an asset, not necessarily its market price, often calculated through fundamental analysis.
Financial Markets
Marketplaces where individuals and institutions can trade financial securities, commodities, and other fungible items of value at low transaction costs.
Q4: Refer to Exhibit 16.1. If the spot
Q7: Open-end investment companies continue to sell and
Q19: A calendar spread requires the purchase and
Q37: Refer to Exhibit 15.19. Indicate the market
Q37: A stock currently trades for $63. Call
Q49: If Sweden exports cell phones to Denmark
Q71: In 2011,health care's share of gross domestic
Q86: Along a downward sloping,linear demand curve,total revenue
Q93: If Brazil has a comparative advantage relative
Q101: In the 1973 movie Save the Tiger,Jack