Figure 13-6
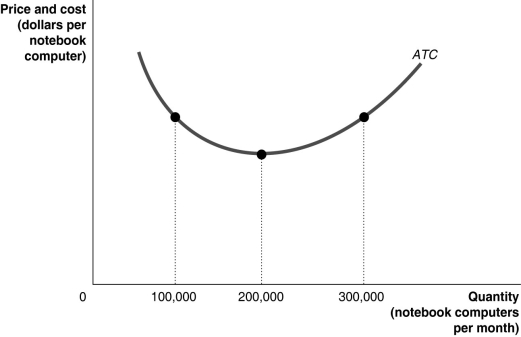
-Refer to Figure 13-6.Suppose the above graph represents the relationship between the average total cost of producing notebook computers and the quantity of notebook computers produced by Dell.On a graph, illustrate the demand, MR, MC, and ATC curves which would represent Dell maximizing profits at a quantity of 100,000 per month and identify the area on the graph which represents the profit.
Definitions:
Q16: When new firms are encouraged to enter
Q23: Assume that a monopolist practices perfect price
Q53: In what way does long-run equilibrium under
Q77: Refer to Figure 15-2.If the monopolist charges
Q86: Refer to Table 15-2.If Comcast wants to
Q93: If a store like hhgregg has higher
Q103: In an oligopoly,minimum efficient scale is likely
Q105: Producers in perfect competition receive a smaller
Q111: A firm will make a profit when<br>A)P
Q134: The De Beers Company blocked competition<br>A)in the