Figure 12-7 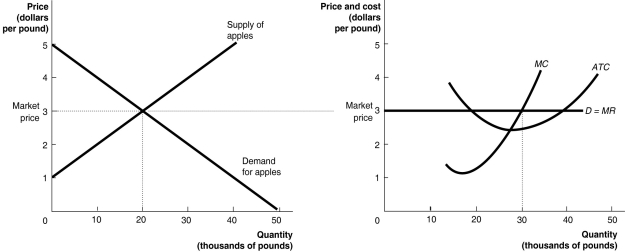 The graphs in Figure 12-7 represent the perfectly competitive market demand and supply curves for the apple industry and demand and cost curves for a typical firm in the industry.
-Refer to Figure 12-7.Which of the following statements is true?
Definitions:
Total Revenue
The total receipts a firm receives from sales of its product or services.
Total Revenue
The overall amount of money generated by a firm from selling its goods or services, calculated as the unit price multiplied by the quantity sold.
Perfectly Inelastic Demand
The case in which the quantity demanded does not respond at all to changes in the price; the demand curve is a vertical line.
Demand Curves
A graph representing the relationship between the price of a good and the quantity of that good buyers are willing to purchase at various prices.
Q32: Refer to Table 10-6.Suppose Antonio has $10
Q46: A perfectly competitive apple farm produces 1,000
Q69: A consumer's budget constraint is<br>A)the limited income
Q77: In the United States,the average person mostly
Q80: A public franchise gives the exclusive right
Q90: What is the difference between "shutting down
Q90: The only firms that do not have
Q91: A network externality causes firms to sacrifice
Q117: One reason that consumers and businesses might
Q125: Because many business situations are repeated games,firms