Figure 12-7 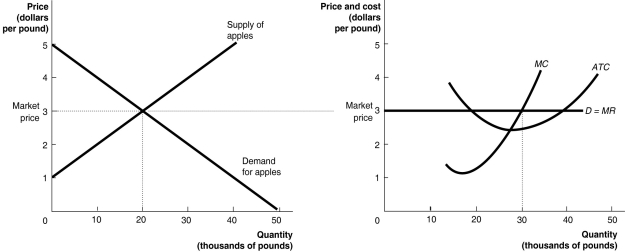 The graphs in Figure 12-7 represent the perfectly competitive market demand and supply curves for the apple industry and demand and cost curves for a typical firm in the industry.
-Refer to Figure 12-7.The graphs depicts a short run equilibrium.How will this differ from the long-run equilibrium? (Assume this is a constant-cost industry.)
Definitions:
Functional Group
A specific group of atoms within a molecule that is responsible for the characteristic chemical reactions of that molecule.
R-OH
This is a general formula representing alcohols where R represents the alkyl group and -OH represents the hydroxyl functional group.
Alcohol
Any organic compound where the hydroxyl functional group (–OH) is bound to a carbon atom.
Aldehydes
Organic compounds characterized by the functional group -CHO, where the carbon atom is double bonded to oxygen and single bonded to hydrogen.
Q1: The relationship between sales and revenue is<br>A)an
Q14: A horizontal merger<br>A)is a merger between firms
Q44: The ability of a firm to charge
Q74: Refer to Figure 12-5.The firm's short-run supply
Q81: Consider the following economic agents: a.the government<br>B.consumers<br>C.producers<br>Who,in
Q85: When Dr.Goldfinger decides on the companies in
Q128: When firms analyze the relationship between their
Q134: Refer to Figure 11-2.In the figure above
Q137: Every society faces economic trade-offs.This means<br>A)some people
Q139: Which of the following statements is true