Table 11-3
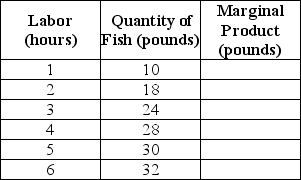
-Refer to Table 11-3.The table above shows the following relationship between hours spent fishing and the quantity of fish caught for Juan,a commercial fisherman.
a.Complete the Marginal Product column in Table 11-3.
b.Characterize the production function,i.e.does the production function display increasing marginal returns,diminishing marginal returns,etc.
c.Using the data above,graph Juan's marginal product curve.Be sure to label the horizontal and vertical axes.Is your graph consistent with your answer to part (b)? Explain.
d.Juan uses the following inputs for fishing - a small wooden boat (B),a fishing pole (P)and of course,his labor (L).Treating the boat and the fishing pole as fixed inputs and using the data above,graph Juan's Total Product of Labor curve.Be sure to label the horizontal and vertical axes.
e.(Extra Credit)The opportunity cost of Juan's time is $8 per hour.If Juan receives $2 per pound for his fish,what is the optimal number of hours he should spend fishing? Explain how you arrived at your answer.Hint: Recall marginal benefit and marginal cost analysis.
Definitions:
Q17: Most economists are concerned about entry barriers.Why
Q28: Which of the following is not an
Q74: Refer to Figure 12-5.The firm's short-run supply
Q93: Assume that a perfectly competitive market is
Q100: Which of the following is a positive
Q101: Minimum efficient scale is defined as the
Q118: When a firm has been granted a
Q123: Competition among sellers generates<br>A)productive efficiency.<br>B)allocative efficiency.<br>C)equity.<br>D)scarcity.
Q124: If price is equal to average variable
Q143: Which of the following is a problem