Figure 3-8 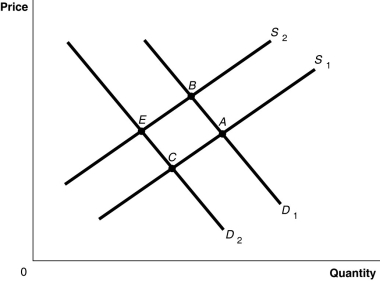
-Refer to Figure 3-8. The graph in this figure illustrates an initial competitive equilibrium in the market for motorcycles at the intersection of D2 and S2 (point E) . If the technology to produce motorcycles improves and the number of buyers increases, how will the equilibrium point change?
Definitions:
Performance
Performance refers to the act of carrying out a task or function, often evaluated in terms of effectiveness, efficiency, or skill.
Socioeconomic Status
A combined measure of an individual's or family's economic and social position relative to others, based on income, education, and occupation.
Sexual Orientation
An inherent or immutable enduring emotional, romantic, or sexual attraction to other people.
Experimental Group
A group made up of subjects who receive a treatment in an experiment.
Q30: In order to be binding a price
Q35: The "Big Mac Theory of Exchange Rates"
Q51: What would happen in the market for
Q70: Refer to Figure 2-8.Which country has a
Q117: For each watch that Switzerland produces,it gives
Q125: Refer to Table 4-7.The equations above describe
Q151: Refer to Table 4-4.If a minimum wage
Q175: Refer to Table 2-8.Which of the following
Q207: Using a supply and demand graph,illustrate the
Q227: Refer to Figure 3-5.In a free market