Table 2-12
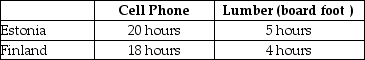
-Refer to Table 2-12.This table shows the number of labor hours required to produce a cell phone and a board foot of lumber in Estonia and Finland.
a.If each country has a total of 3,600 labor hours to devote to the production of the two goods,draw the production possibilities frontier for each country.Put "Cell Phone" on the horizontal axis and "Lumber" on the vertical axis.Be sure to identify the intercept values on your graphs.
b.Suppose each country allocates 55% its labor hours to lumber production and 45% to the production of cell phones.Complete Table 2-13 below to show each country's output of the two products.
Table 2-13: Production and Consumption with no Trade
 c.If the two countries do not trade and consume whatever they produce,identify the current production and consumption point for each country on their respective production possibilities frontiers.Label Estonia's consumption point "E" and Finland's consumption point,"F."
d.Suppose the two countries specialize and trade.Who should produce cell phones and who should produce lumber? Explain your answer.
e.Complete Table 2-14 below to show each country's output with specialization.
Table 2-14: Output with Specialization
 f.Did specialization increase the combined output for the two countries without any increase in resources? If so,by how much?
g.Suppose Estonia and Finland agree to trade so that in exchange for 400 board feet of lumber,the exporter of lumber receives 90 cell phones.Complete Table 2-15 below to show each country's consumption bundle after trade.
Table 2-15: Consumption with Trade
 h.Show the consumption points after trade on each country's production possibilities frontier.Label these points "X" for Estonia and "Y" for Finland.
i.Has trade made the two countries better off? Explain your answer.
Definitions:
Negatively Correlated
Describes a relationship between two variables where as one variable increases, the other decreases.
Wealth
Wealth represents the abundance of valuable financial assets or physical possessions which can include money, real estate, and personal property, contributing to an individual's or group's financial security.
Marital Satisfaction
The degree of contentment and fulfillment a person feels in their marriage or long-term intimate partnership.
Regression Toward
Refers to the statistical phenomenon where extreme values in data tend to return or "regress" towards the average over time.
Q36: A depreciation of a country's currency always
Q36: Refer to Figure 4-5.Suppose that instead of
Q62: Why might a developing country choose to
Q69: The current account balance equals the value
Q69: The Danish currency,the krone,is pegged to the
Q71: Refer to Figure 18-2.Which of the events
Q99: What is a surplus? What is a
Q123: Identify whether each of the following transactions
Q204: Refer to Table 2-9.Japan has a comparative
Q239: Increasing a fixed exchange rate is called