Table 2-12
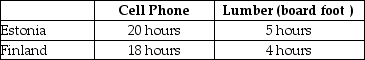
-Refer to Table 2-12.This table shows the number of labor hours required to produce a cell phone and a board foot of lumber in Estonia and Finland.
a.If each country has a total of 3,600 labor hours to devote to the production of the two goods,draw the production possibilities frontier for each country.Put "Cell Phone" on the horizontal axis and "Lumber" on the vertical axis.Be sure to identify the intercept values on your graphs.
b.Suppose each country allocates 55% its labor hours to lumber production and 45% to the production of cell phones.Complete Table 2-13 below to show each country's output of the two products.
Table 2-13: Production and Consumption with no Trade
 c.If the two countries do not trade and consume whatever they produce,identify the current production and consumption point for each country on their respective production possibilities frontiers.Label Estonia's consumption point "E" and Finland's consumption point,"F."
d.Suppose the two countries specialize and trade.Who should produce cell phones and who should produce lumber? Explain your answer.
e.Complete Table 2-14 below to show each country's output with specialization.
Table 2-14: Output with Specialization
 f.Did specialization increase the combined output for the two countries without any increase in resources? If so,by how much?
g.Suppose Estonia and Finland agree to trade so that in exchange for 400 board feet of lumber,the exporter of lumber receives 90 cell phones.Complete Table 2-15 below to show each country's consumption bundle after trade.
Table 2-15: Consumption with Trade
 h.Show the consumption points after trade on each country's production possibilities frontier.Label these points "X" for Estonia and "Y" for Finland.
i.Has trade made the two countries better off? Explain your answer.
Definitions:
Companies
Legal entities formed by individuals, shareholders, or stakeholders with the purpose of operating for profit, engaging in commercial, industrial, or professional activities.
Bargain Purchase Option
An option in a lease agreement that allows the lessee to purchase the leased asset at the end of the lease term at a price significantly below its expected fair market value.
Executory Costs
Executory costs are expenses associated with fulfilling the terms of a contract, typically not included in the initial acquisition cost of an asset.
Guaranteed Residual Value
The minimum future value of an asset as guaranteed by a third party or agreement upon the asset's lease end.
Q6: Tax incidence is the actual division of
Q9: Refer to Figure 3-6.The figure above represents
Q12: Under the gold standard,the government must have
Q26: Refer to Figure 19-12.The graph above depicts
Q32: Companies in the sharing economy,such as Airbnb
Q35: Refer to Table 2-11.This table shows the
Q40: Refer to Table 2-2.Assume Nadia's Neckties only
Q44: If a country has a fixed exchange
Q105: The "Big Mac Theory of Exchange Rates"
Q130: Refer to Figure 2-13.Which two arrows in