Multiple Choice
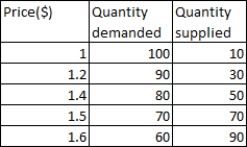
The table given below shows the quantity supplied and the quantity demanded for a good at different prices.If the price of the good described in the table given below is $1.60,then there is a: Table 4.1
Definitions:
Related Questions
Q11: Opportunity cost is the difference between the
Q41: Household income is spent on all of
Q46: Hans can do 4 loads of laundry
Q48: If corn and soybean are alternative crops
Q63: The term "fine-tuning the economy" implies:<br>A)making government
Q73: When economists refer to an economy's price
Q101: Inflation can only be caused by an
Q108: Which of the following is true of
Q114: Consider a market for kids' shoes that
Q149: Which of the following is a major