Multiple Choice
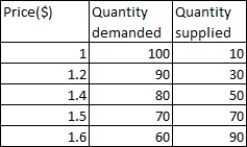
The table given below shows the quantity supplied and the quantity demanded for a good at different prices.If the price of the good described in the table given below is $1.50,then:
Table 4.1
Definitions:
Related Questions
Q22: If the real GDP of a country
Q32: Consider the market for a good that
Q36: Environmentalists have continually argued for the use
Q71: The aim of supply-side economics is to:<br>A)increase
Q98: Which of the following would most likely
Q128: Natural monopolies occur when:<br>A)government antitrust laws are
Q134: Which of the following best describes a
Q139: Which of the following is a characteristic
Q145: Which of the following groups experiences high
Q147: A price ceiling set above the equilibrium