Multiple Choice
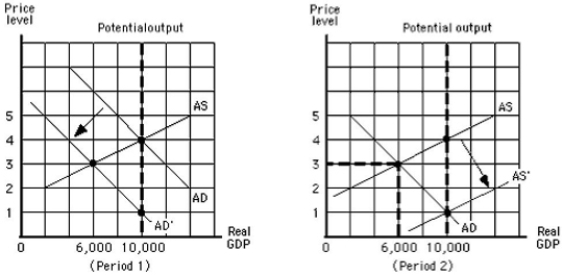
The figure below shows the aggregate demand and supply curves for the U.S.The figure given below shows that between period 1 and period 2 nominal GDP changed from $40,000 to:
Figure 5.2
Definitions:
Related Questions
Q14: In contrast to government research and development,private
Q25: Which of the following is an example
Q34: Suppose there is a 5 percent increase
Q53: Rhonda sells a house she has owned
Q60: People who are not currently employed but
Q67: Suppose an economy had an inflation rate
Q105: If future price changes were perfectly anticipated
Q111: The following figure shows the production possibilities
Q128: In the long run,the economy needs applied
Q136: Since the end of World War II,the