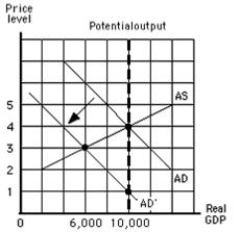
The figure below shows the aggregate demand and supply curves for the U.S.The figure given below shows that the price level changes from _____ when the aggregate supply curve shifts from AS' to AS''.
Figure 5.3
Definitions:
Q15: In the double-entry bookkeeping system used to
Q19: In the figure given below that shows
Q25: The higher the anticipated inflation rate,_.<br>A)the more
Q56: Luigi owns and operates a small restaurant.The
Q67: The gross domestic product of Solvasa,a small
Q84: Construction workers at times face high rates
Q119: If a firm hires labor for $4,000,pays
Q123: Which of the following statements about leading
Q141: Over the last century,U.S.labor productivity has:<br>A)fallen.<br>B)been constant,on
Q169: Households supply four basic types of resources.They