Multiple Choice
The following image shows the aggregate demand and aggregate supply curves of an economy.In the graph below,the rise in the price levels from P1 to P2 is a result of:
Figure 7.1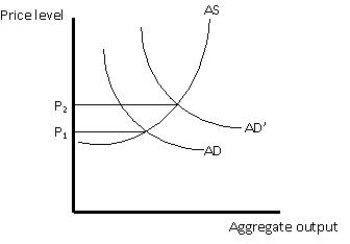
Recognize the role of genetics and biological factors in determining sexual orientation.
Understand the criticisms and limitations of research studies on sexual orientation.
Understand the concepts of socialization and its significance in societal structures.
Analyze social phenomena through the lens of major sociological theories such as functionalism and conflict theory.
Definitions:
Related Questions
Q18: The figure below shows short-run equilibrium in
Q32: The diminishing slope of the per-worker production
Q44: The nominal gross domestic product (GDP)for a
Q48: An increase in the market interest rate,other
Q79: The figure below shows three different per-worker
Q90: The table below shows the real gross
Q94: If an economy produces final output worth
Q112: Most of the unemployment during the Great
Q147: If a household's income falls from $20,000
Q150: Per capita GDP in the United States