The figure given below shows equilibrium in a money market.If S is the supply curve,the equilibrium interest rate and quantity of money will be: Figure 15.2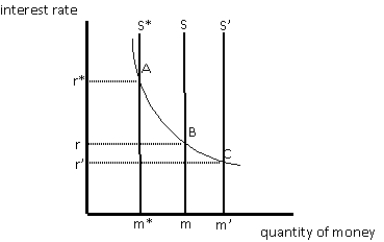
Definitions:
Portfolio
An assortment of financial assets including stocks, bonds, commodities, cash, and equivalents, as well as mutual funds and exchange-traded funds (ETFs).
Standard Deviation
A statistical measure that quantifies the variation or dispersion of a set of data points.
Fire Insurance
A type of insurance policy that covers damage and losses caused by fire.
Rule Of 70
A simple way to estimate the number of years it takes for an amount to double, by dividing the number 70 by the annual growth rate percentage.
Q16: Those who favor a passive approach to
Q36: The following graph shows the demand for
Q62: An exchange rate is the price of
Q81: The Fed's purchase of U.S.government securities constitutes
Q86: An identity is a relationship expressed in
Q90: The purpose of deregulating banks during the
Q108: The following table shows per-day production data
Q119: Which of the following are legal tender?<br>A)A
Q124: If the Fed increases the required reserve
Q131: If an economy's actual GDP exceeds its