Multiple Choice
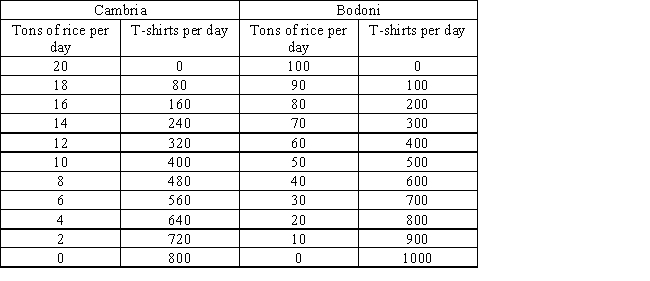
The following table shows per-day production data of rice and T-shirts for two countries,Cambria and Bodoni.Based on the table,it can be said that the opportunity cost of 1 T-shirt in Bodoni is _____.
Table 17.1
Definitions:
Related Questions
Q2: It can be argued that 'heritage assets'
Q10: The following comments might be made about
Q11: Compare government financial statistics with the general
Q54: When the Fed buys U.S.government securities from
Q70: If the short-run aggregate supply curve is
Q96: One likely reason that the country of
Q97: The table below shows the balance sheet
Q123: The initial Phillips curve relationship implied that
Q134: Which of the following reasons best explains
Q147: The primary tool the Fed uses to