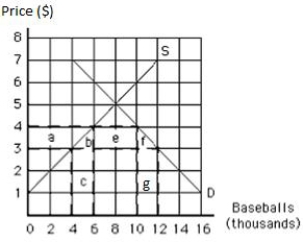
The following graph shows the supply of and demand for baseballs in the United States.If the world price is $3 per baseball and a tariff of $1 per baseball is imposed,then the number of baseballs imported is _____.
Figure 17.3
Definitions:
Effective Interest Method
A way of amortizing the bond premium or discount over the life of the bond in a manner that reflects a constant rate of interest.
Bond Premium
The amount by which the market price of a bond exceeds its principal amount or face value, typically as a result of changes in interest rates.
Interest Expense
The expenses an entity faces for borrowing funds, encompassing payments for loans, bonds, or credit lines.
Effective Rate
Refers to the real rate of interest earned or paid on an investment, loan, or other financial product, adjusted for the effect of compounding over a given period.
Q1: An effective import quota:<br>A)lowers the price of
Q19: Which of the following statements about the
Q42: Current account transactions are records of the
Q61: According to the rational expectations theory,monetary policy
Q66: A movement upward and to the left
Q86: The Bretton Woods agreement established the gold
Q91: Which of the following was a motive
Q92: Other things constant,the quantity of money demanded
Q120: Which of the following central banks does
Q148: Which of the following resources is necessary