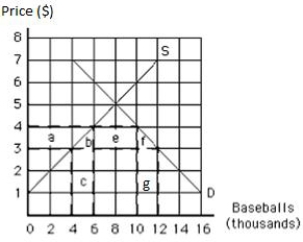
The following graph shows the supply of and demand for baseballs in the United States.If the world price is $3 per baseball and a tariff of $1 per baseball is imposed,then the tariff revenue collected by the United States government is shown by the area _____.
Figure 17.3
Definitions:
Q2: Some economists believe that in the long
Q3: If the value of the spending multiplier
Q4: Government departments should be classified as 'reporting
Q7: Labor productivity depends on:<br>A)the effectiveness of government.<br>B)the
Q7: 'Assessing the costs and benefits of ethical
Q15: When people exchange money for financial assets,the
Q60: For the U.S.,a drop in the price
Q73: Advocates of the passive approach to government
Q122: A nation's merchandise trade balance reflects _.<br>A)trade
Q137: The purchasing power parity (PPP)theory suggests the