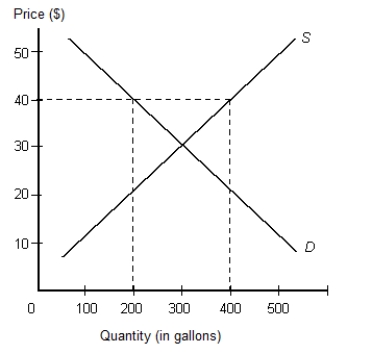
The below figure shows the demand and supply curves in the market for gasoline. The price and quantity at the point of intersection of the demand and supply curves is $30 and 300 gallons respectively.Figure 3.6

-Without money, no transaction can occur.
Definitions:
Treasury Notes
Intermediate-term U.S. government debt security with a maturity of 1 to 10 years and pays interest every six months.
Maturity at Issue
The predetermined date when a financial instrument, such as a bond, will come due and the principal is to be paid back to investors.
Default Risk
The potential risk that an issuer of a bond or other debt security will be unable to make principal and interest payments when due.
Collateral Trust Bond
A type of bond that is secured by a pledge of collateral, typically securities, placed under the trust of a third party.
Q2: When a market is in surplus, there
Q17: Other things being equal, if there is
Q20: A firm gets less efficient as it
Q41: When people make choices that (at the
Q60: All of the following,except one,are factors of
Q77: Which of the following will most likely
Q78: Refer to the information above to answer
Q82: According to economic theory, the difference between
Q94: What do economists mean when they say
Q100: If the price of chocolate increases by