Multiple Choice
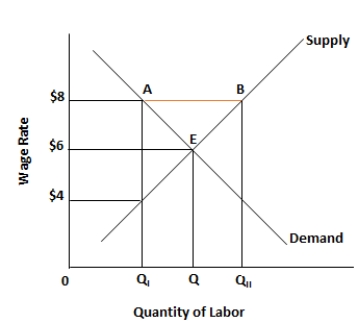
Figure 5.3. The figure shows the wage rate and the quantity of labor supplied in an unskilled labor market. 
-Refer to figure 5.3. Which of the following is true?
Definitions:
Related Questions
Q13: In the long run, if the output
Q25: Because incomes are limited, purchasing one thing
Q29: If short-run average total costs are rising
Q31: Why is economics relevant?
Q35: In Table 8.5, if the total fixed
Q38: In a market economy, _ own(s) all
Q43: According to the law of diminishing utility,
Q73: Overfishing and extinction of species arise because
Q96: Refer to Table 7.5. Given that the
Q135: Discuss the pros and cons of economic