True/False
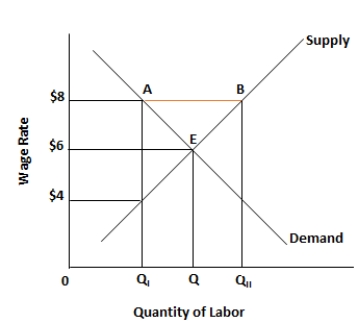
Figure 5.3. The figure shows the wage rate and the quantity of labor supplied in an unskilled labor market. 
-The production possibilities curve of a low income country lies outside the production possibilities curve of a high income country.
Definitions:
Related Questions
Q10: An example of barter is voluntary work
Q11: If a 1 percent change in the
Q11: In order to have a meaningful measure
Q27: Utility is easy to measure in the
Q38: Refer to the graph above to answer
Q39: Suppose the value of price elasticity of
Q49: A price floor is the minimum price
Q67: Which of the following is explained by
Q102: The cross-price elasticity between baseballs and tennis
Q105: When the average total cost is at