Multiple Choice
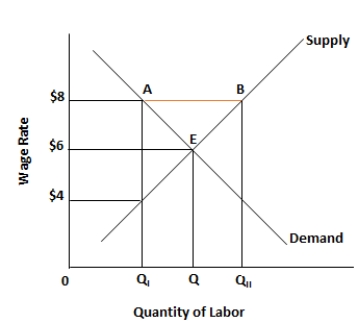
Figure 5.3. The figure shows the wage rate and the quantity of labor supplied in an unskilled labor market. 
-If a 50 percent increase in the price of pizza results in a 25 percent decrease in the quantity demanded of pizza, then the price elasticity of demand for pizza:
Definitions:
Related Questions
Q1: If a consumer is spending a small
Q11: Refer to figure 5.3. Which of the
Q15: A person has a comparative advantage in
Q36: In Table 8.5, the marginal cost of
Q47: Nicky makes $25,000 a year as a
Q51: Other things remaining unchanged, the longer the
Q56: The different combinations of any two goods
Q63: Which of the following is a result
Q101: If a 10 percent increase in price
Q121: A price change triggers the income effect