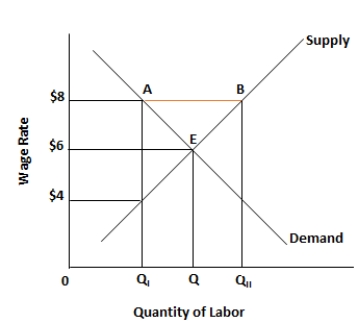
Figure 5.3. The figure shows the wage rate and the quantity of labor supplied in an unskilled labor market. 
-If a 10 percent increase in the price of gasoline results in a 2 percent decrease in the quantity demanded of gasoline, then the elasticity of demand for gasoline is:
Definitions:
Demand Curve
An illustrated chart that displays the connection between a product's price and the amount consumers are willing to buy at those price levels.
Individual Demand
The amount of a product or service that a single consumer is willing and able to purchase at various prices, holding all else constant.
Society Demand
This refers to the total demand for various goods and services by all members of a society or community, often influenced by factors like price, income levels, and societal norms.
Public Goods
Goods that are non-excludable and non-rivalrous, meaning they can be consumed by one individual without reducing availability to others and without a direct cost.
Q9: National economic policies are usually set by
Q15: The phrase "to spread the overhead" refers
Q24: Graphically, a firm's profit per unit of
Q33: Consider the production possibilities curve [PPC] for
Q35: In economics, the term investment refers to:<br>A)the
Q56: The term net exports refers to:<br>A)the situation
Q76: Inferior goods are low quality goods that
Q99: Which of the following statements characterizes perfect
Q125: With an increase in income, the consumer
Q148: All of the following except one are