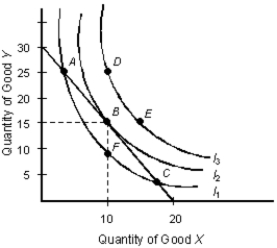
The below figure shows the various combinations of the goods X and Y that yield different levels of utility.Figure 7.3

-According to neuroeconomists, our logical brain knows we should spend as much as possible when we have money.
Definitions:
Extraordinary Gains
Profits from events or transactions that are both unusual in nature and infrequent in occurrence, though this distinction has been eliminated in current accounting practices.
Pretax Loss
The loss a company incurs before taxes are deducted.
Pretax Gain
The profit a company has made before any taxes have been applied.
Tax Rate
The rate at which income is taxed for a person or a business entity.
Q3: Price elasticity of demand measured over a
Q15: If the price elasticity of supply is
Q27: The ability of a firm to charge
Q34: In Figure 7.3, the consumer is in
Q35: In Table 8.5, if the total fixed
Q48: Which of the following is a basic
Q50: In the long run, a perfectly competitive
Q54: Under the long-run equilibrium, for perfectly competitive
Q79: Refer to Table 8.1. What will be
Q96: For a monopolist with a linear demand