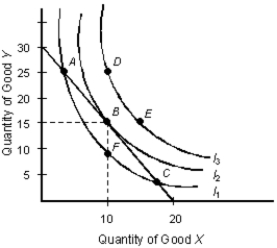
The below figure shows the various combinations of the goods X and Y that yield different levels of utility.Figure 7.3

-Assume that one laborer produces 6 units of output, two laborers produce 14 units, three laborers 22 units, four laborers 24 units, and five laborers 25 units. Diminishing returns set in when the firm hires:
Definitions:
Total Variable Expenses
The sum of all costs that vary directly with the level of production or sales volume over a specific period.
Degree of Operating Leverage
A financial metric that measures the sensitivity of a company's operating income to its sales volume.
Break-even Point
The level of production or sales at which total revenues equal total expenses, resulting in no net loss or gain.
Contribution Margin
The amount by which sales revenue exceeds variable costs. It contributes to covering fixed costs and generates profit.
Q17: Assume that due to unfavorable conditions in
Q24: Which of the following is true of
Q33: A perfectly competitive producer's demand curve is:<br>A)a
Q33: Refer to Table 7.4. With an income
Q57: A firm enjoys a positive economic profit
Q57: Consider the perfectly competitive firm described in
Q89: Refer to Figure 11.7. At the profit
Q102: When marginal utility is positive and increasing,
Q116: Given a perfectly competitive market structure at
Q136: In utility analysis, it is assumed that