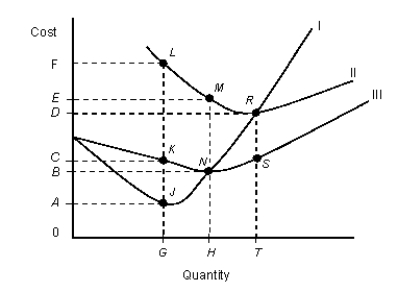
The figure given below shows cost curves of a firm.Figure: 8.2
 In the figure,
|: Marginal cost curve
||: Average total cost curve
|||: Average variable cost curve
-Refer to Figure 8.2. At an output level of G:
Definitions:
CCPHA Campaign
An initiative or series of actions conducted by the California Center for Public Health Advocacy aimed at promoting public health awareness and policy change.
Soda Tax
Government-imposed tax on sugary beverages to combat obesity and health issues while generating revenue.
Sugary Drinks
Beverages containing added sugars such as sodas, sports drinks, and fruit-flavored drinks, often linked to health issues like obesity and diabetes.
Interstate Commerce Commission
A former agency of the U.S. government responsible for regulating the economics and services of specified carriers engaged in transportation between states.
Q15: Which of the following is a possible
Q18: A producer can raise profit by expanding
Q33: The income transferred by the government from
Q44: An enterprise that has only one shareholder
Q49: The coefficient of the price elasticity of
Q59: According to Figure 7.1, which of the
Q70: Graphically, a firm's total cost is equal
Q84: For a given product, income elasticity of
Q85: To decide which of the two goods
Q107: When revenue is less than total cost