The following graph shows the marginal revenue (MR) and marginal cost (MC) curves of an imperfectly competitive firm.Figure 9.2
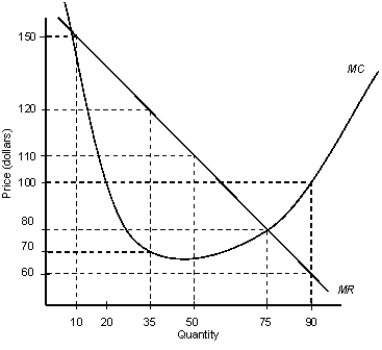
-Refer to Figure 9.2. At a quantity of 10 units, the firm should _____ , and at a quantity of 75 units, the firm should _____.
Definitions:
Water Retention
The accumulation of excess fluids in the body tissues, often leading to swelling.
Nonparents
Individuals who do not have children, either by choice or circumstance.
Child-Free
Individuals or couples who choose not to have children.
Infertile
The inability to conceive a child after a year or more of regular sexual intercourse without the use of birth control.
Q2: Assume that one laborer produces 6 units
Q40: Which of the following is true of
Q45: Cross-price elasticity is represented by the formula
Q62: The owner of a good has the
Q64: The profit of a perfectly competitive firm
Q73: If at the profit maximizing level of
Q85: One major similarity between perfect competition and
Q96: For a monopolist with a linear demand
Q98: A firm's total revenue is $400 for
Q105: The prices that people are willing to