The figure given below shows the cost curves of a firm.Figure 9.3
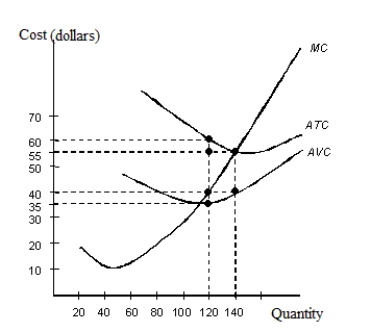 ATC: Average Total Cost
AVC: Average Variable Cost
MC: Marginal Cost
-In Figure 9.3, what is the marginal cost at a quantity of 120 units?
Definitions:
Perfect Competition
A market structure characterized by a large number of small firms, a homogeneous product, free entry and exit, and perfect information, leading to price takers.
Price Taker
A market participant that accepts the prevailing prices in the market, unable to influence prices through their own actions.
Perfectly Competitive
A market structure characterized by a large number of buyers and sellers, homogeneous products, free entry and exit, and perfect information, leading to zero economic profit in the long run.
Standardized Product
Goods or services that are uniform in quality and performance across different producers and can be easily substituted for one another.
Q3: Refer to Scenario 8.1. Compute Jane's economic
Q10: If butter has an income elasticity equal
Q11: A firm's marginal cost equals the:<br>A)ratio of
Q20: If the government is successful in internalizing
Q32: According to Figure 11.8, what will be
Q70: Total utility is maximized when _.<br>A)the marginal
Q85: The actual or chronological time for the
Q85: Steve is about to start up a
Q95: The monopolistically competitive firm, in Figure 12.3,
Q138: Buyers who are persuaded to take a