The figure given below shows the revenue and cost curves of a perfectly competitive firm.Figure 10.2
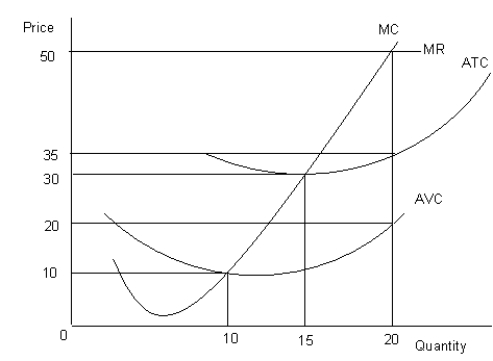 MC: Marginal cost curve
MR: Marginal revenue curve
ATC: Average-total-cost curve
AVC: Average-variable-cost curve
-Refer to Figure 10.2. If the marginal-revenue curve would have intersected the average-total-cost curve at the latter's lowest point and the firm maximized profit, then total profit would have been equal to:
Definitions:
Representative Sample
A fraction of a population that reliably reflects the traits of the entire group.
Random Sample
A method of selecting a subset of individuals from a population in which each person has an equal chance of being chosen.
Double-Blind Experiment
An experimental design in which neither the participants nor the experimenters know who is receiving a particular treatment, to prevent bias.
Case Study
A detailed analysis of a person, group, event, or situation over a period of time, used as a research method in psychology and other disciplines.
Q1: Mr. Max is about to purchase 4
Q6: Assume the price facing the firm in
Q11: A monopolist's demand curve is less elastic
Q18: If a consumer is buying three goods
Q39: At its minimum point, the average-total-cost curve
Q56: The different combinations of any two goods
Q84: When the marginal costs of firms in
Q97: According to Table 8.3, the firm's marginal
Q103: Refer to Table 12.2. If firm B
Q116: Refer to Figure 11.5. Which of the