True/False
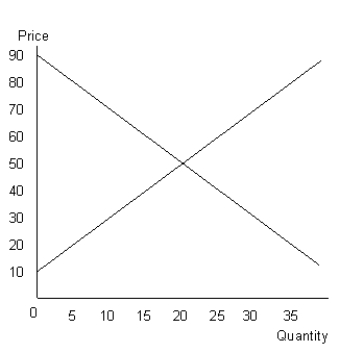
The figure given below shows the aggregate demand and supply curves of a perfectly competitive market.Figure 10.7

-Under perfect competition, the average revenue curve of the firm coincides with its average cost curve.
Definitions:
Related Questions
Q6: If firms have to change their production
Q22: Monopolization is a process by which the
Q31: An increase in income _.<br>A)makes the budget
Q64: The profit of a perfectly competitive firm
Q66: The greater the consumer's reluctance to shift
Q67: Which one of the following is based
Q85: Steve is about to start up a
Q88: Marginal utility is total utility divided by
Q98: Utility is most closely defined as _.<br>A)the
Q110: Suppose that if there are n users