True/False
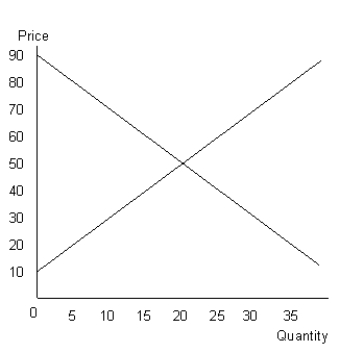
The figure given below shows the aggregate demand and supply curves of a perfectly competitive market.Figure 10.7

-In long-run equilibrium in perfect competition, the entry and exit of firms will drive economic profits to zero.
Definitions:
Related Questions
Q1: Mr. Max is about to purchase 4
Q10: If social regulation causes the supply curve
Q36: Total utility is determined by:<br>A)multiplying the quantity
Q51: A monopolist can charge whatever price it
Q52: According to Figure 10.2, the break-even price
Q57: An indifference map shows _.<br>A)all combinations of
Q75: _ is the change in total utility
Q91: If demand is relatively elastic and supply
Q101: If the cost borne by a firm
Q112: The government should subsidize the production of