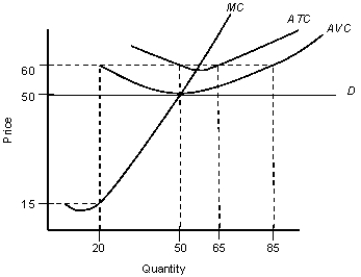
The figure given below shows the demand and cost curves of a perfectly competitive firm.Figure: 10.4
 D: Demand curve
MC: Marginal cost curve
ATC: Average-total cost curve
AVC: Average-variable-cost curve
-Some competitive firms are willing to operate at a loss, in the short run, because:
Definitions:
Knowledge
Information, understanding, or skills gained through experience or education.
Abilities
Natural or acquired skills and talents that enable individuals to perform tasks or actions effectively.
Cultural Belief
Pertains to the common values, norms, and practices that are shared among members of a particular culture.
Individualism
A social theory or ideology valuing the independence and self-reliance of the individual over collective or communal goals.
Q1: When more and more doses of fertilizers
Q41: The Clean Air Act of 1972 required
Q57: An indifference map shows _.<br>A)all combinations of
Q63: In Table 9.1, if the firm produces
Q72: As new firms enter a monopolistically competitive
Q89: If in the short run, at the
Q94: If a monopolist is producing the output
Q100: In Table 8.4, at 4 units of
Q130: Suppose that apples and bananas both cost
Q142: If all consumers had identical preferences, then