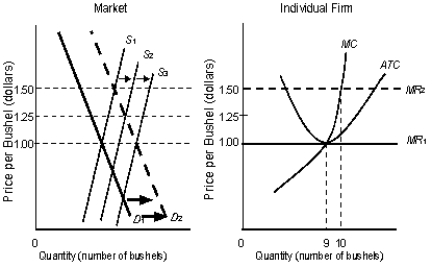
The following figure shows equilibrium at the industry and firm level.Figure 10.6
 In the figure,
S1, S2, S3 are the market supply curves.D1 and D2 are the market demand curves.MC is the marginal cost curve of the firm.MR1 and MR2 are the marginal revenue curves of the firm.ATC is the average-total-cost curve of the firm.
-When firms leave a perfectly competitive market, then, other things remaining unchanged:
Definitions:
Q44: Which of the following is an example
Q48: Most natural monopolies are regulated at some
Q59: Which of the following is not correct
Q75: In the context of market structure, the
Q76: A firm will demand more units of
Q88: Marginal utility is total utility divided by
Q89: Suppose a budget line is drawn with
Q96: For which of the following types of
Q101: If the cost borne by a firm
Q111: Firms under perfect competition produce:<br>A)homogeneous products.<br>B)unique products.<br>C)either