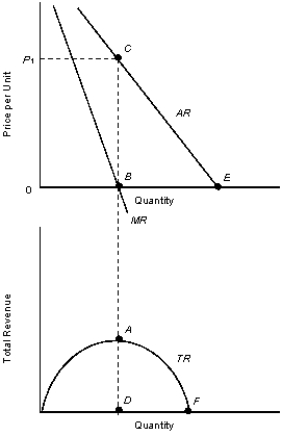
The figures given below represent the revenue curves of a monopolist.Figure 11.2
 TR: Total revenue curve
AR: Average revenue curve
MR: Marginal revenue curve
-Refer to Figure 11.2. If the output at E is 600 units, then the output at B is _____ units. (We know that the slope of the marginal revenue curve is twice the slope of the average revenue curve.)
Definitions:
Financial Matters
Issues or activities related to the management, investment, and control of money and assets.
Venture Capital Fund
A fund that invests in high-growth companies in exchange for equity, or ownership stakes, typically in early-stage companies.
Private Placement
The offering of securities to a relatively small number of select investors as a way of raising capital.
Flotation Costs
Expenses incurred by a company in issuing new stocks or bonds, including underwriting costs, legal fees, and registration fees.
Q6: The existence of positive externalities in the
Q10: One of the reasons that communism failed
Q24: Which of the following may be explained
Q30: According to Figure 14.6, what is the
Q31: An increase in income _.<br>A)makes the budget
Q44: According to the payoffs in Table 12.1:<br>A)firm
Q51: Regulation of monopolies is justified on the
Q59: Identify the correct statement.<br>A)A monopolist's pricing decision
Q93: Refer to Figure 14.4. A monopsonist will
Q109: Households' expenditure on goods and services are