Multiple Choice
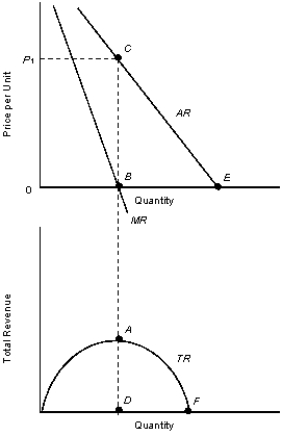
The figures given below represent the revenue curves of a monopolist.Figure 11.2
 TR: Total revenue curve
AR: Average revenue curve
MR: Marginal revenue curve
-A monopolist maximizes profit:
Definitions:
Related Questions
Q21: Suppose a friend gives you two pieces
Q21: According to Figure 10.4, the firm's shutdown
Q24: Assume that the firm described in Table
Q35: After hiring 151 units of the variable
Q39: An efficient way to move toward the
Q40: The long-run average total cost curve represents:<br>A)the
Q45: Above-normal profits earned by existing firms in
Q62: If an industry experiences economies of scale
Q78: When a private transaction imposes costs on
Q80: The entry of new firms into a