The figure below shows the market equilibrium (point B) at the intersection of demand and supply curves under perfect competition.Figure 11.5
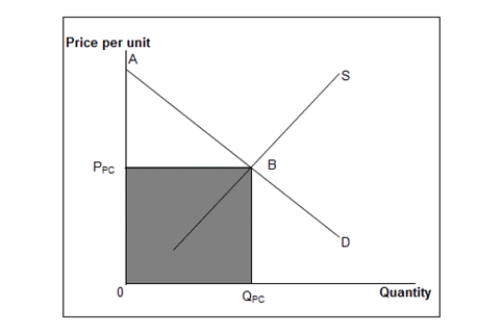 D: Market demand curve
S: Market supply curve
-Assume that in Figure 11.5, the market is originally perfectly competitive but then becomes a monopoly. Compared with perfect competition, a monopoly would have:
Definitions:
World Price
The price of a good or service in the international market, often used as a benchmark for comparing domestic prices.
International Trade
International trade involves the exchange of goods and services across international borders, allowing countries to expand their markets and pursue competitive advantages.
Tariffs
Taxes imposed by a government on imported goods and services to restrict imports or generate revenue.
Import Quotas
Restrictions set by a country on the quantity of goods that can be imported within a certain time frame to protect domestic industries.
Q5: A firm wishing to maximize profits will
Q15: Assume that a firm's marginal revenue curve
Q47: According to Table 14.1, if the wage
Q52: Which of the following statements is true?<br>A)Leisure
Q64: If the average variable cost of a
Q66: The substitution effect occurs because when the
Q79: Assume that in Figure 11.5, the market
Q92: The opportunity cost of going to movies
Q97: Assume that the resource market shown in
Q106: The theory of bounded rationality states that