Multiple Choice
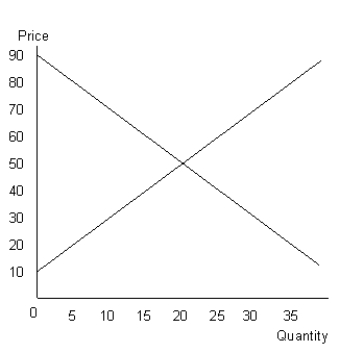
The figure given below shows the aggregate demand and supply curves of a perfectly competitive market.Figure 10.7

-Which of the following is true of the demand curve faced by a monopolist?
Definitions:
Related Questions
Q28: If MU<sub>X</sub> / P<sub>X</sub> < MU<sub>Y</sub> /
Q30: A monopolist can charge a high price
Q39: The value of the marginal product of
Q55: Refer to Figure 14.4. A competitive labor
Q82: According to economic theory, the difference between
Q84: As long as the marginal utilities per
Q88: According to Figure 12.1, the profit-maximizing firm
Q115: Refer to Table 10.1. If the market
Q117: Refer to Figure 10.3 and calculate the
Q117: "Throwing good money after bad" is also