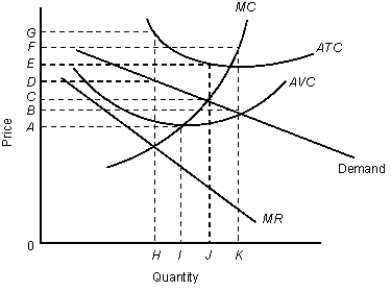
The figure given below shows revenue and cost curves of a monopolistically competitive firm.Figure: 12.1
 In the figure,
MR: Marginal revenue curve
ATC: Average total cost curve
AVC: Average variable cost curve
MC: Marginal cost curve
-Consider the monopolistically competitive firm described in the Figure 12.1. The profit-maximizing output level and price are _____ and _____ respectively.
Definitions:
Positive Elements
Aspects or components of a situation or environment that contribute positively to the desired outcome or goal.
Future Search Conferences
A planning meeting that helps transform an organization's capability for action by focusing on shared values and common futures.
Organizational Change Activities
Initiatives and efforts aimed at modifying business processes, corporate culture, or organizational structure.
Entire System
A holistic view that considers all the components and interactions within a system, rather than focusing on individual parts alone.
Q2: Assume that one laborer produces 6 units
Q12: Which of the following is not a
Q30: The International Communication Network which is the
Q34: Refer to Figure 10.7 and calculate the
Q38: A perfectly competitive firm cannot affect the
Q40: A monopolistically competitive firm faces a relatively
Q44: Consider a market consisting of seven firms
Q88: Which of the following was formed in
Q89: A person who takes less care of
Q120: If market demand increases, a perfectly competitive