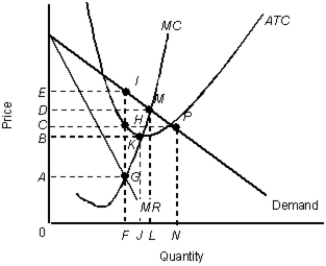
The figure given below shows the revenue and cost curves of a monopolistically competitive firm.Figure 12.4
 MR: Marginal revenue curve
ATC: Average total cost curve
MC: Marginal cost curve
-In monopolistic competition, firms may differentiate their products in many ways except on the basis of:
Definitions:
Learning Curves
The theory that productivity and efficiency improve with experience and repetition, often represented by a graph showing a decrease in labor time per unit as production volume increases.
Supply-Chain Negotiations
The process of reaching agreements within the supply chain about terms, prices, delivery schedules, and other pivotal factors affecting the supply and distribution of goods.
Learning Curve
A graphical representation showing how an increase in learning or experience can lead to improved performance or decreased cost over time.
Q3: If significant barriers to entry exist in
Q6: A college student's choice of a major
Q41: Suppose a tax rate of 10 percent
Q45: Which of the following is not a
Q70: Which of the following is true of
Q73: When Glaxo-Wellcome introduced AZT, an AIDS drug,
Q76: Suppose that the demand for apples in
Q92: Which of the following would account for
Q110: One of the popular myths about monopoly
Q130: A firm will shut down permanently if