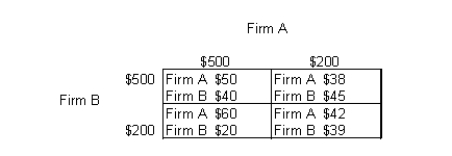
The table below shows the payoff (profit) matrix of Firm A and Firm B indicating the profit outcome that corresponds to each firm's pricing strategy (where $500 and $200 are the pricing strategies of two firms).Table 12.2

-As a firm in a monopolistically competitive market successfully differentiates its products and earns a positive economic profit, it is soon imitated by its rivals and profit of the firm falls to zero.
Definitions:
Fixed Costs
Expenses that do not change with the level of production or sales over a short period, such as rent and salaries.
Variable Cost
Costs that change in proportion to the level of goods or services that a business produces.
Breakeven Volume
The quantity of products sold or services rendered at which total revenues equal total costs, resulting in no net loss or gain.
Sales Revenues
The income earned by a company from its sales of goods or the provision of services before any costs or expenses are deducted.
Q3: The good for which neither the principle
Q5: One cause of market failure may be
Q14: At an output level above the profit-maximizing
Q23: Which of the following practices is not
Q51: In Figure 17.1, if the demand curve
Q63: The ratio of the median income of
Q86: Supporters of comparable worth claim that market
Q87: Why do skilled workers earn relatively higher
Q104: Refer to Table 14.1. If both the
Q106: Which of the following is true of