The figure below shows the demand and supply curves in the market for elementary education.Figure 13.1
In the figure,
D: Private demand curve for elementary education
D + s: Demand curve which includes public benefits
S: Supply curve of education
Price and Quantity have been taken on vertical and horizontal axes respectively. 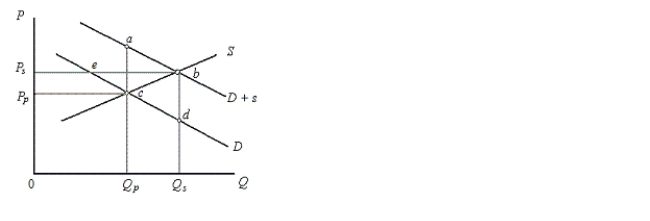
-According to Figure 13.1, the outcome of an unregulated, unsubsidized market would be:
Definitions:
Saving Rate
The portion of income that is not spent on consumption but rather saved or invested.
Double Taxation
The imposition of taxes on the same income, assets, or financial transaction at two different levels of government, such as corporate income being taxed both to the corporation and to the shareholders when distributed as dividends.
Economic Growth
A rise in the production of goods and services per capita over a certain time frame.
Saving Rate
The proportion of income that is not spent on consumption but is instead saved by individuals or entities.
Q6: The existence of positive externalities in the
Q9: Refer to Scenario 14.1. If the worker
Q12: A clothing store can sell two shirts
Q30: A firm's accounting profit is always equal
Q40: Which of the following statements contradicts an
Q62: Under the Clinton administration, attempts were made
Q75: Which of the following professionals is likely
Q88: A monopolist enjoys the least market power
Q90: According to Figure 11.8, the deadweight loss
Q110: The principal argument against comparable worth is