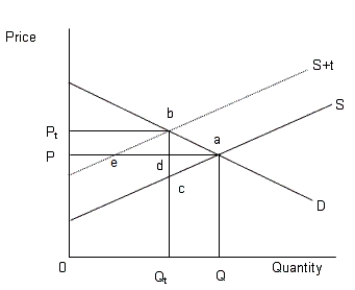
The figure given below shows the demand and supply curves of automobiles.Figure 13.3
In the figure,
D: Demand curve of automobiles
S: Supply of automobiles prior to the tax
S+t: Supply of automobiles after the tax

-The European Union Emission Trading Scheme is an example of:
Definitions:
Quality Improvement Program
A systematic approach to the assessment and improvement of services and operational processes to meet or exceed customer expectations.
Convergent Thinking
A cognitive process in which a person attempts to find a single, correct answer to a problem.
Deductive Reasoning
An analytic approach where an outcome is concluded from the synchronization of several bases presumed to be true.
Inductive Reasoning
A method of reasoning in which general conclusions are drawn from specific observations or instances.
Q5: Consider the monopolist described in Figure 11.3.
Q11: If the Herfindahl index for automobiles take
Q26: Refer to Figure 10.7 and calculate the
Q42: A primary market refers to a market
Q45: Which of the following statements is not
Q48: If the marginal factor cost is greater
Q61: The market structure called monopolistic competition is
Q98: Transfer earning is the minimum amount that
Q105: Shane holds wealth worth $10,000. He considers
Q111: Suppose you inherit the only spring of