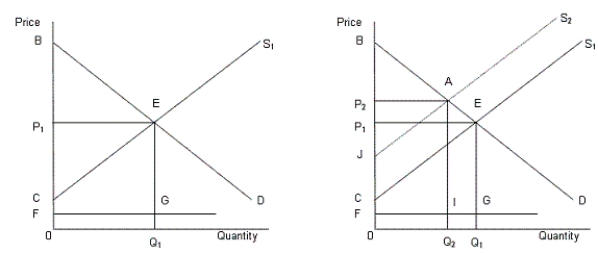
In the following figure, the first panel shows a market situation prior to regulation and the second panel shows the effects of regulation.Figure 14.2
 In the figure,
D: Demand curve for automobiles
S1: Supply curve of automobiles prior to regulation
S2: Supply curve of automobiles after regulation
FG: Clean up cost per unit
-What is the total social surplus prior to regulation, in Figure 14.2?
Definitions:
Open-market Purchase
The buying of securities by a central bank from the market to inject liquidity and encourage economic growth.
Aggregate Demand
The complete need for goods and services across an economy at an established price level within a specific period.
Government Spending
The total amount of money spent by the government on various services, infrastructure projects, and welfare programs.
Marginal Propensity
A measure of how much an individual's or household's consumption changes when their income changes by one unit.
Q11: Refer to Table 13.2. Suppose fish sells
Q11: If the Herfindahl index for automobiles take
Q34: Figure 13.1 represents a situation of:<br>A)positive externalities.<br>B)negative
Q48: As a perfectly competitive firm produces at
Q53: Certain actions by oligopolistic firms can lead
Q56: Successful product differentiation by a monopolistically competitive
Q66: Refer to Table 11.4. Assuming that the
Q66: Which of the following statements is true?<br>A)In
Q73: Other things being equal, the marginal revenue
Q79: The cost borne by an individual user