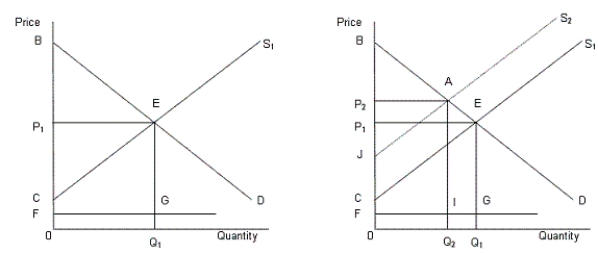
In the following figure, the first panel shows a market situation prior to regulation and the second panel shows the effects of regulation.Figure 14.2
 In the figure,
D: Demand curve for automobiles
S1: Supply curve of automobiles prior to regulation
S2: Supply curve of automobiles after regulation
FG: Clean up cost per unit
-Which of the following raises the economic freedom of a country?
Definitions:
Right-Skewed
Describes a distribution of data where the tail on the right side of the histogram is longer or fatter than the left side, indicating that the mean and median are greater than the mode.
Normal Probability Distribution
A bell-shaped curve distribution characterized by its mean and standard deviation, with data symmetrically distributed around the mean.
Standard Deviation
A statistical measurement that quantifies the dispersion or spread of a set of data points around their mean.
Normal Probability Distribution
A bell-shaped curve distribution that is symmetric about the mean, showing that data near the mean are more frequent in occurrence.
Q5: One difference between economic and social regulation
Q5: The more inelastic the supply of a
Q10: A firm's break-even price is the price
Q35: Yield on a bond refers to:<br>A)the coupon-rate
Q36: Which of the following is a cash
Q54: Under the long-run equilibrium, for perfectly competitive
Q74: A perfectly competitive firm incurs a loss
Q80: Which of the following statements is true?<br>A)Income
Q90: According to Figure 11.8, the deadweight loss
Q99: According to Table 12.2, if firm A