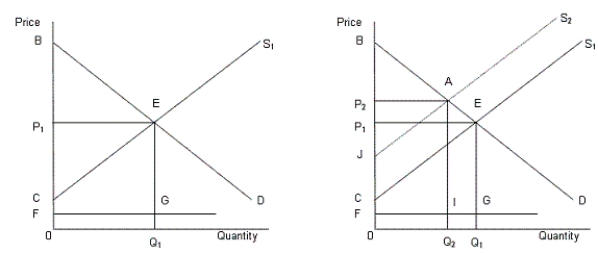
In the following figure, the first panel shows a market situation prior to regulation and the second panel shows the effects of regulation.Figure 14.2
 In the figure,
D: Demand curve for automobiles
S1: Supply curve of automobiles prior to regulation
S2: Supply curve of automobiles after regulation
FG: Clean up cost per unit
-Under the Clinton administration, attempts were made to relax the antitrust enforcement efforts of the Reagan administration.
Definitions:
Ribbon
A user interface element that organizes command buttons, tools, and other controls into a series of tabs at the top of a window, commonly found in Microsoft products.
Themes
Predefined sets of visual design elements and colors that can be applied to software interfaces or documents to create a coherent look and feel.
Presentation Title
The main heading or title that identifies the theme or subject of a slideshow or presentation document.
Slide Layouts
Pre-designed templates within presentation software that dictate the arrangement of content on a slide.
Q6: Burger King has a direct demand for
Q15: If a gas station selling gasoline is
Q19: If a Lorenz curve is drawn using
Q23: Dividend yield is:<br>A)the annual dividend payment per
Q28: In Figure 16.6, assume that micro and
Q39: Production becomes more efficient if a common
Q59: Suppose a monopolistically competitive firm is producing
Q67: According to Table 12.1, if firm X
Q71: Refer to Figure 14.1. The natural monopolist
Q83: When the commons are converted into privately